

Try it with demo data
A fresh install is empty. The repository includes a generator that fills the database with synthetic posts about a fictional coastal city, "Marlow Bay": transit delays, a harbor festival, housing, water quality and more. Nothing in it comes from real people or real events, so it is safe to explore, screenshot and share.
The fastest way
You need Node 22 and Docker, and nothing else:
git clone https://github.com/spiculedata/social-explorer.git
cd social-explorer/ex-accell-ui
npm run demo
This starts a throwaway PostgreSQL with pg_duckdb in a Docker container (on 127.0.0.1:55432), loads the demo dataset and runs the app on http://localhost:5173, reachable only from your machine. A random sign-in is generated, printed in the terminal and kept in ex-accell-ui/.demo/ (ignored by git), so running it again resumes with the same login and data.
| Command | Does |
|---|---|
npm run demo | Start, or resume, the demo |
npm run demo -- --stop | Stop the database container and keep its data |
npm run demo -- --reset | Delete the demo database and generated sign-in |
It never writes your .env or touches any database other than its own container. To load the data into a database you already run, use the manual steps below.
Load it into your own database
You need the stack running (see Getting started) and a checkout of the repository, because the loader runs from source:
cd ex-accell-ui
npm ci
DATABASE_URL=postgresql://postgres:<your POSTGRES_PASSWORD>@localhost:5432/analytics npm run seed:demo
The loader applies any pending schema migrations, then inserts about 1,500 posts across 90 days, with sentiment, emotions, topics, languages and engagement for each, plus two projects with workspaces and three datasets. It only loads into an empty database and refuses otherwise. To replace existing data on a throwaway demo database:
ALLOW_DEMO_RESET=1 npm run seed:demo -- --resetDANGER
--reset truncates the analytics tables and, through foreign keys, everything that hangs off them: posts and their analysis, projects, workspaces, members and datasets. Never run it against a database you care about.
The data is deterministic apart from its dates, which are relative to the day you load it, so the default 7, 30 and 90 day filters always show activity.
A quick tour
Sign in as the admin you created, then pick Marlow Bay Civic Pulse in the project switcher.
Home
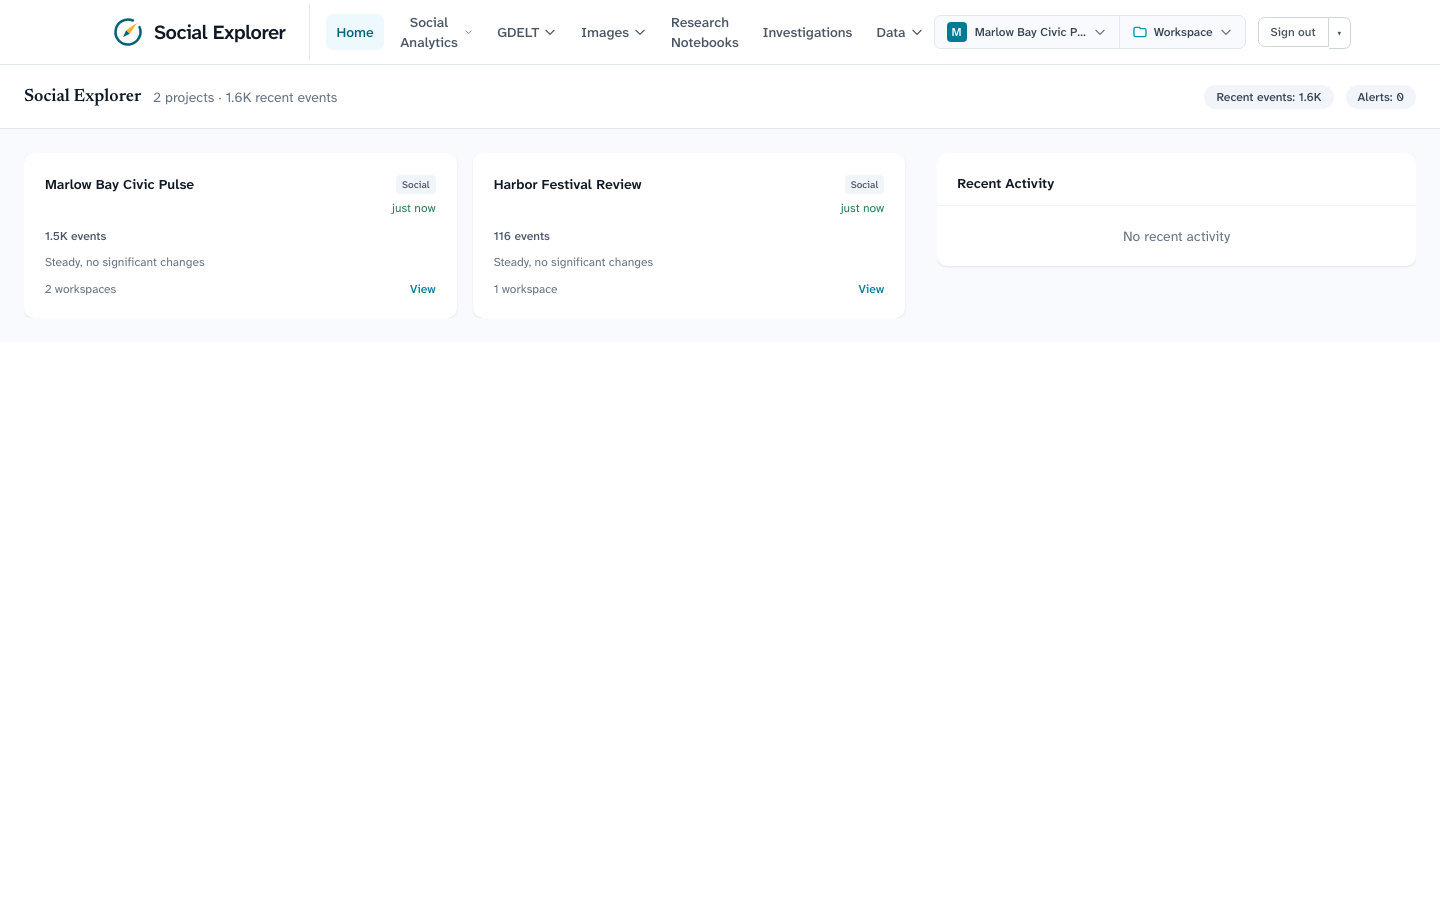
Projects appear as cards with their event counts and recent activity.
Projects
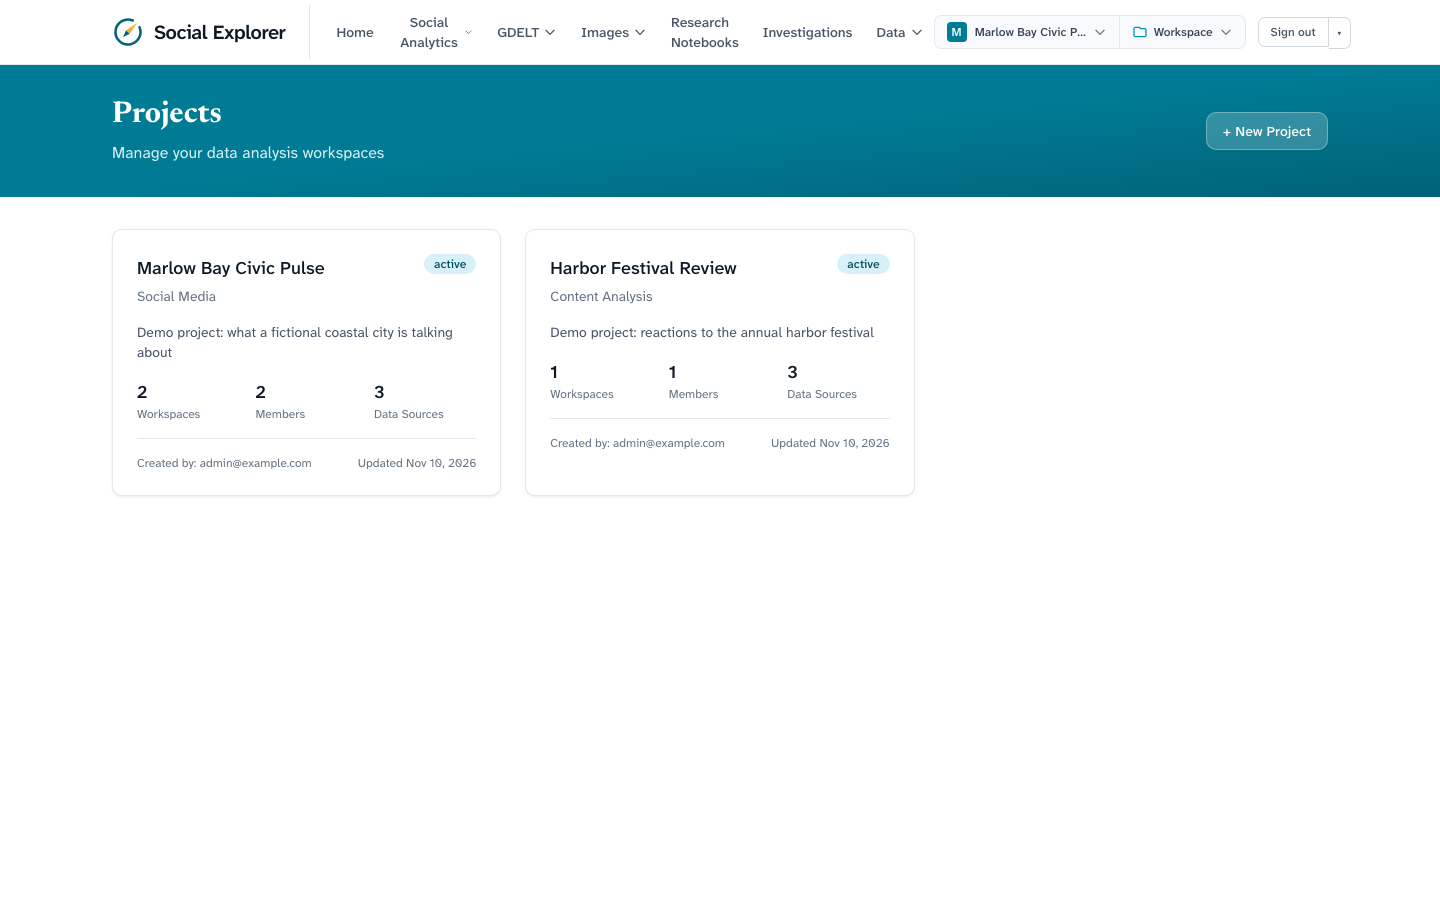
Each project groups workspaces, members and data sources.
Sentiment analysis
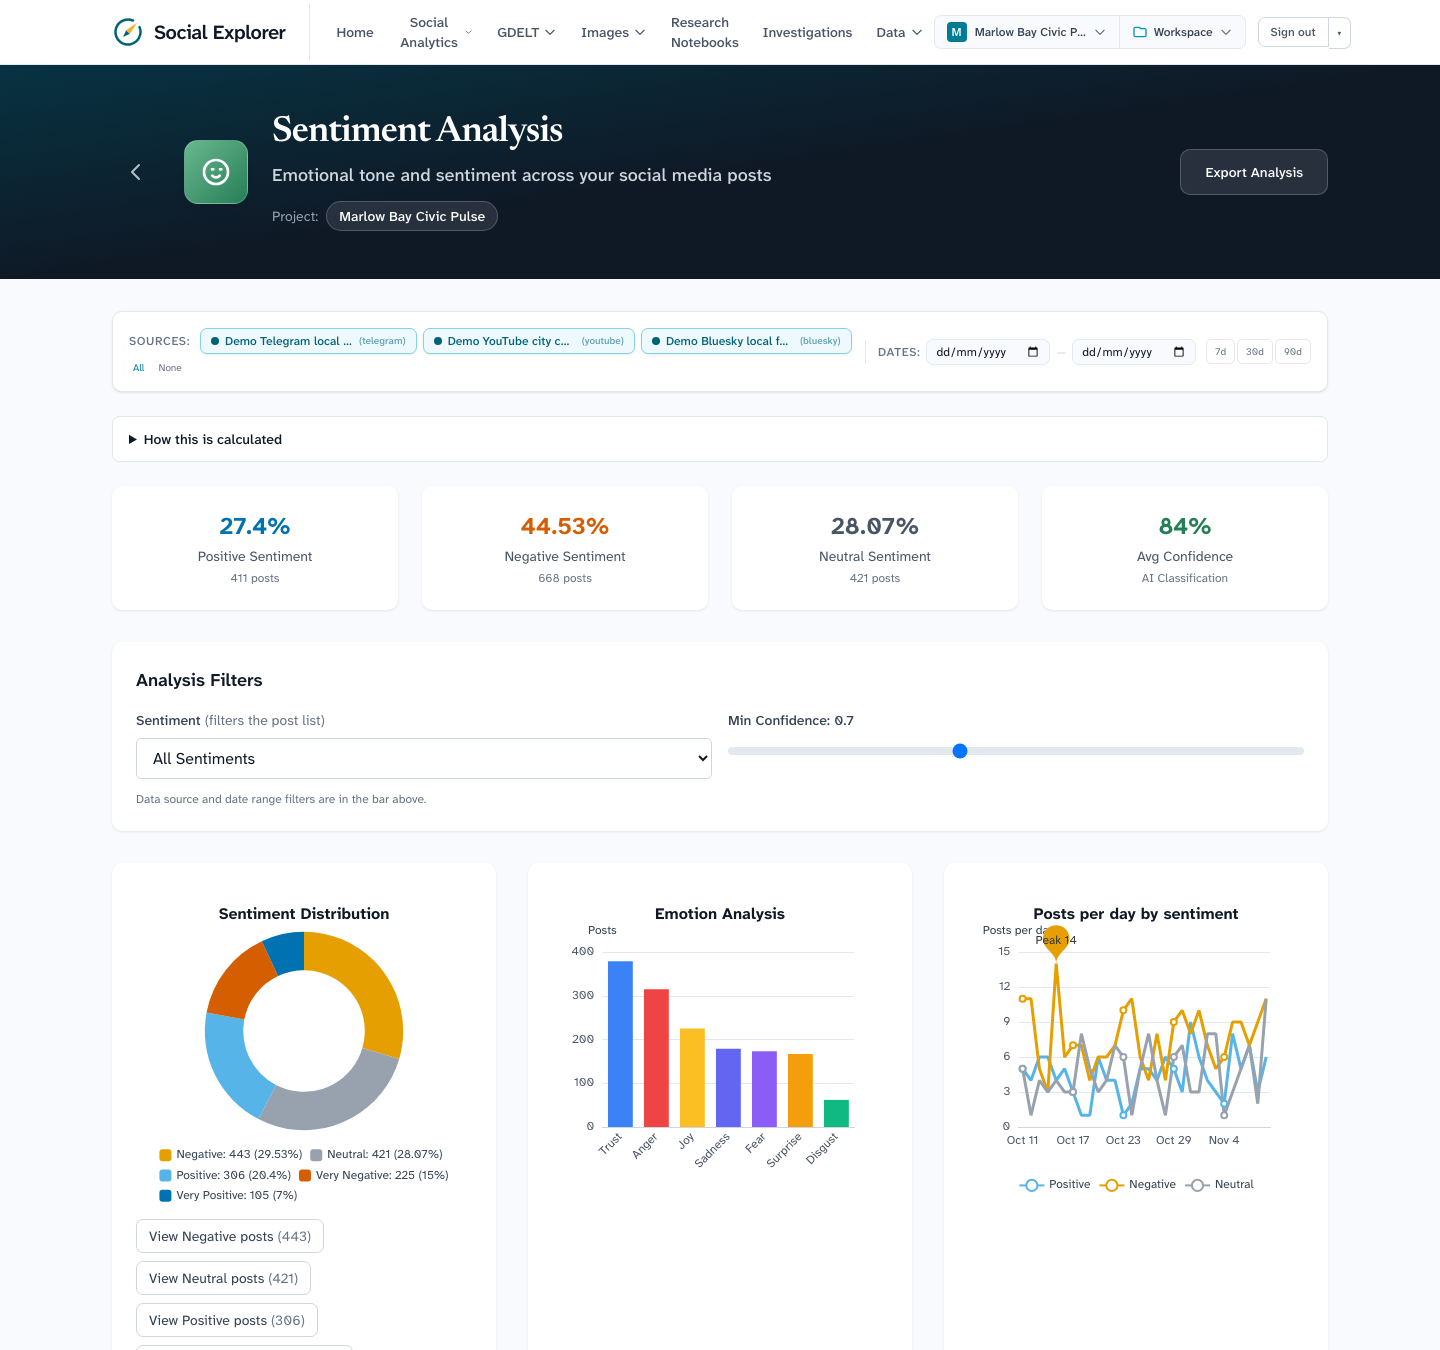
Under Social Analytics → Sentiment Analysis, the headline cards show the positive, negative and neutral share of posts. The charts show the distribution, the emotions behind it, and the trend over time. Scroll down for individual posts with their classification and confidence.
Try the demo's built-in storylines: a spike of negative public transit posts about two thirds of the way through the window, a burst of positive harbor festival posts earlier, and a heatwave near the end.
Topic modeling
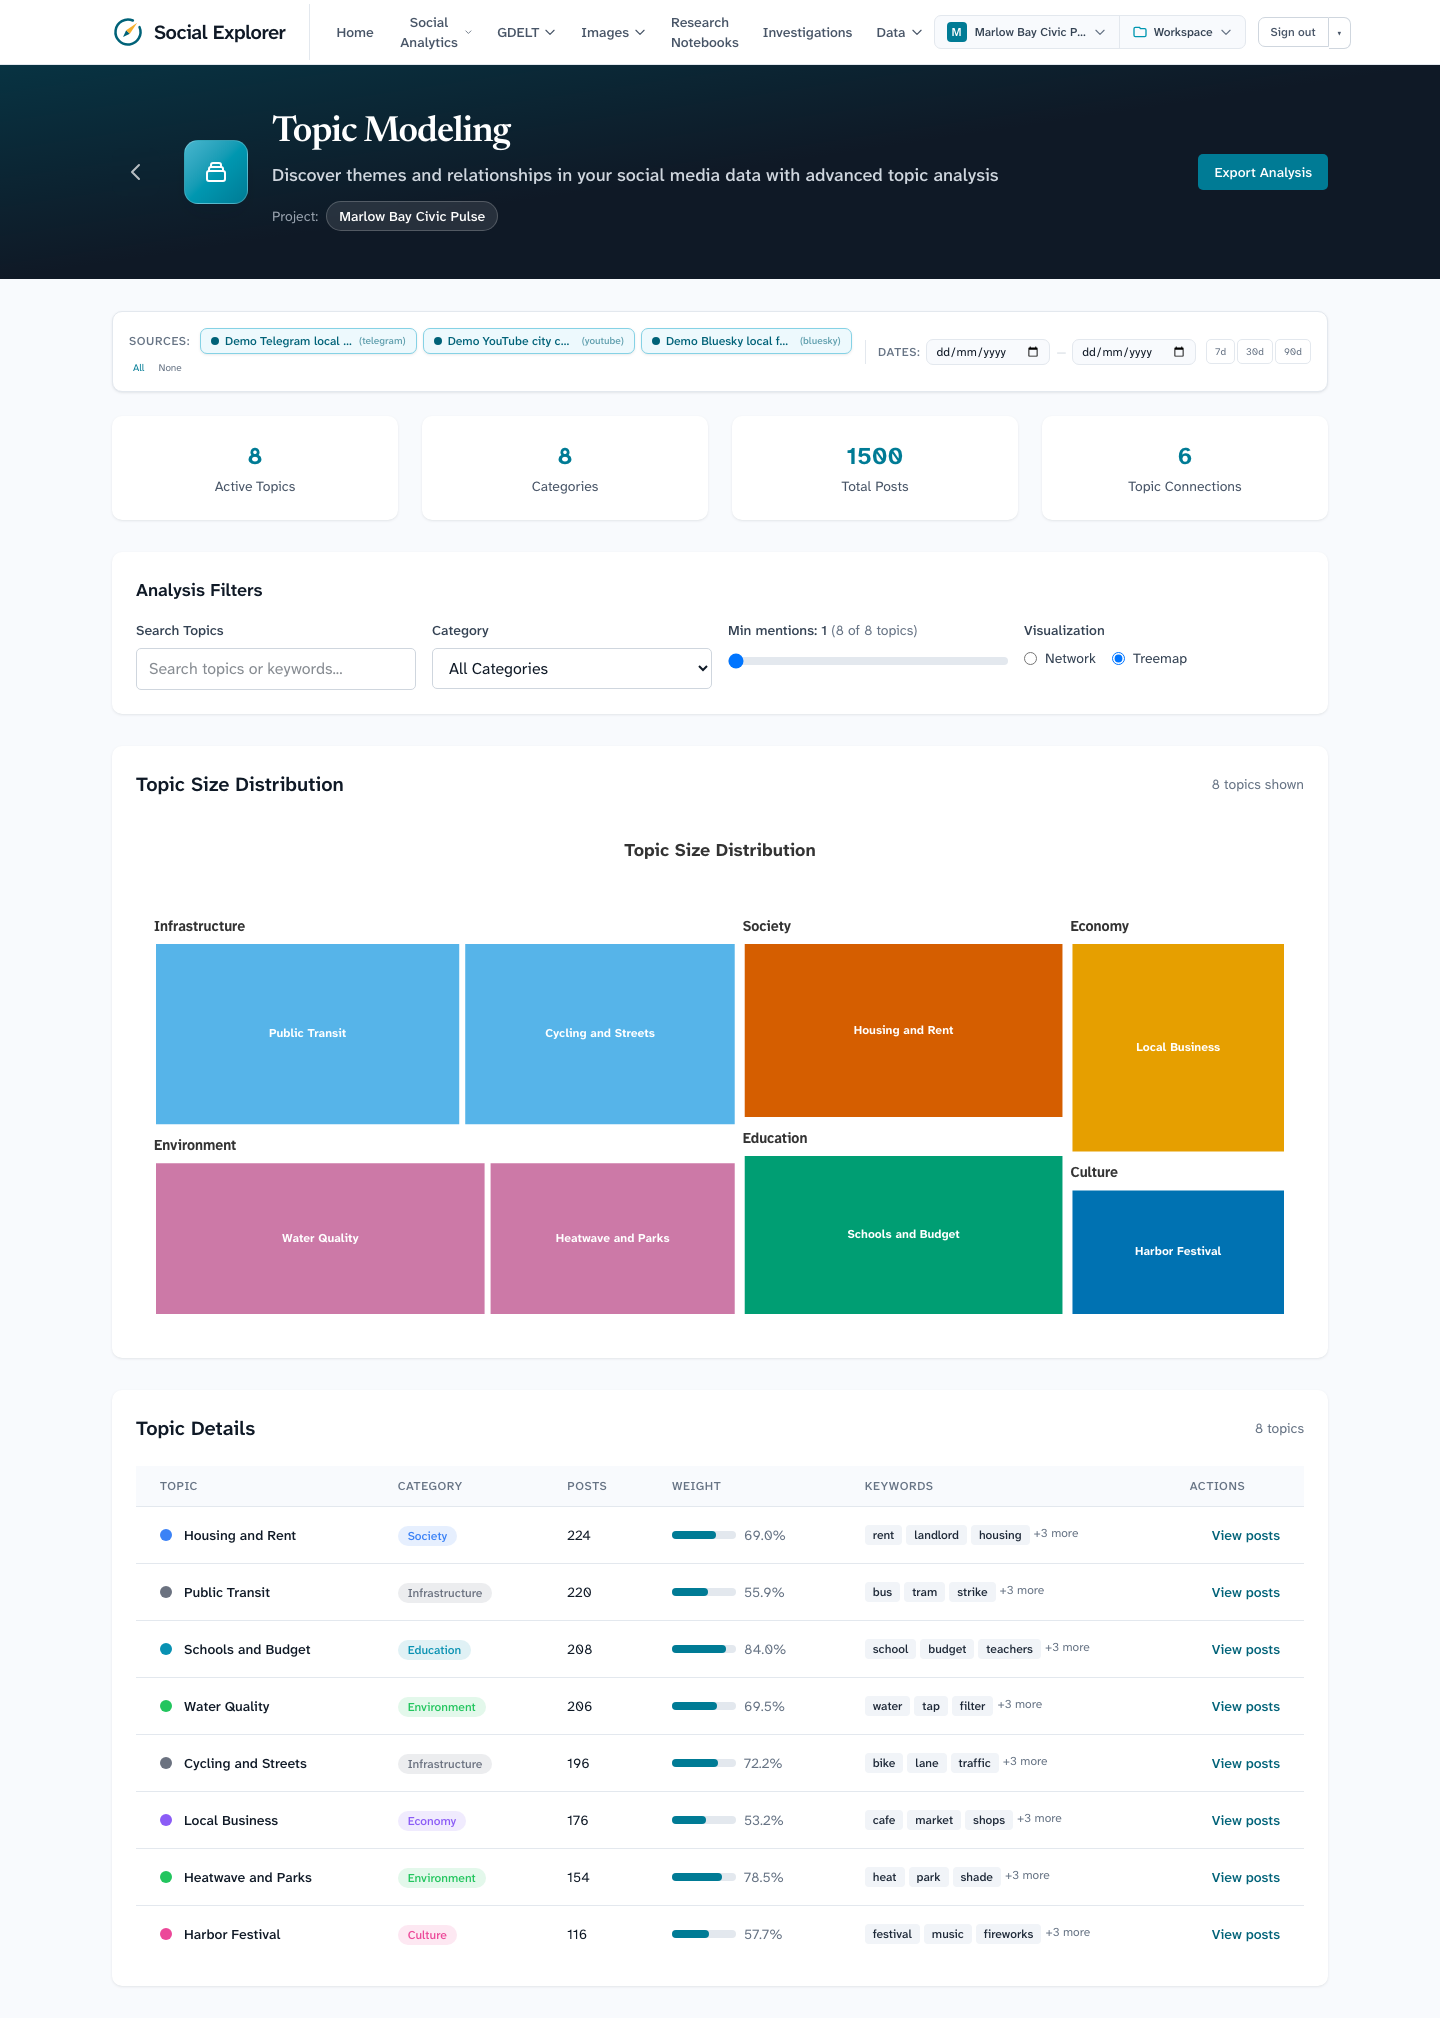
Under Social Analytics → Topic Modeling, the network shows how the eight topics relate, and the table ranks them by post count and weight.
Engagement analysis
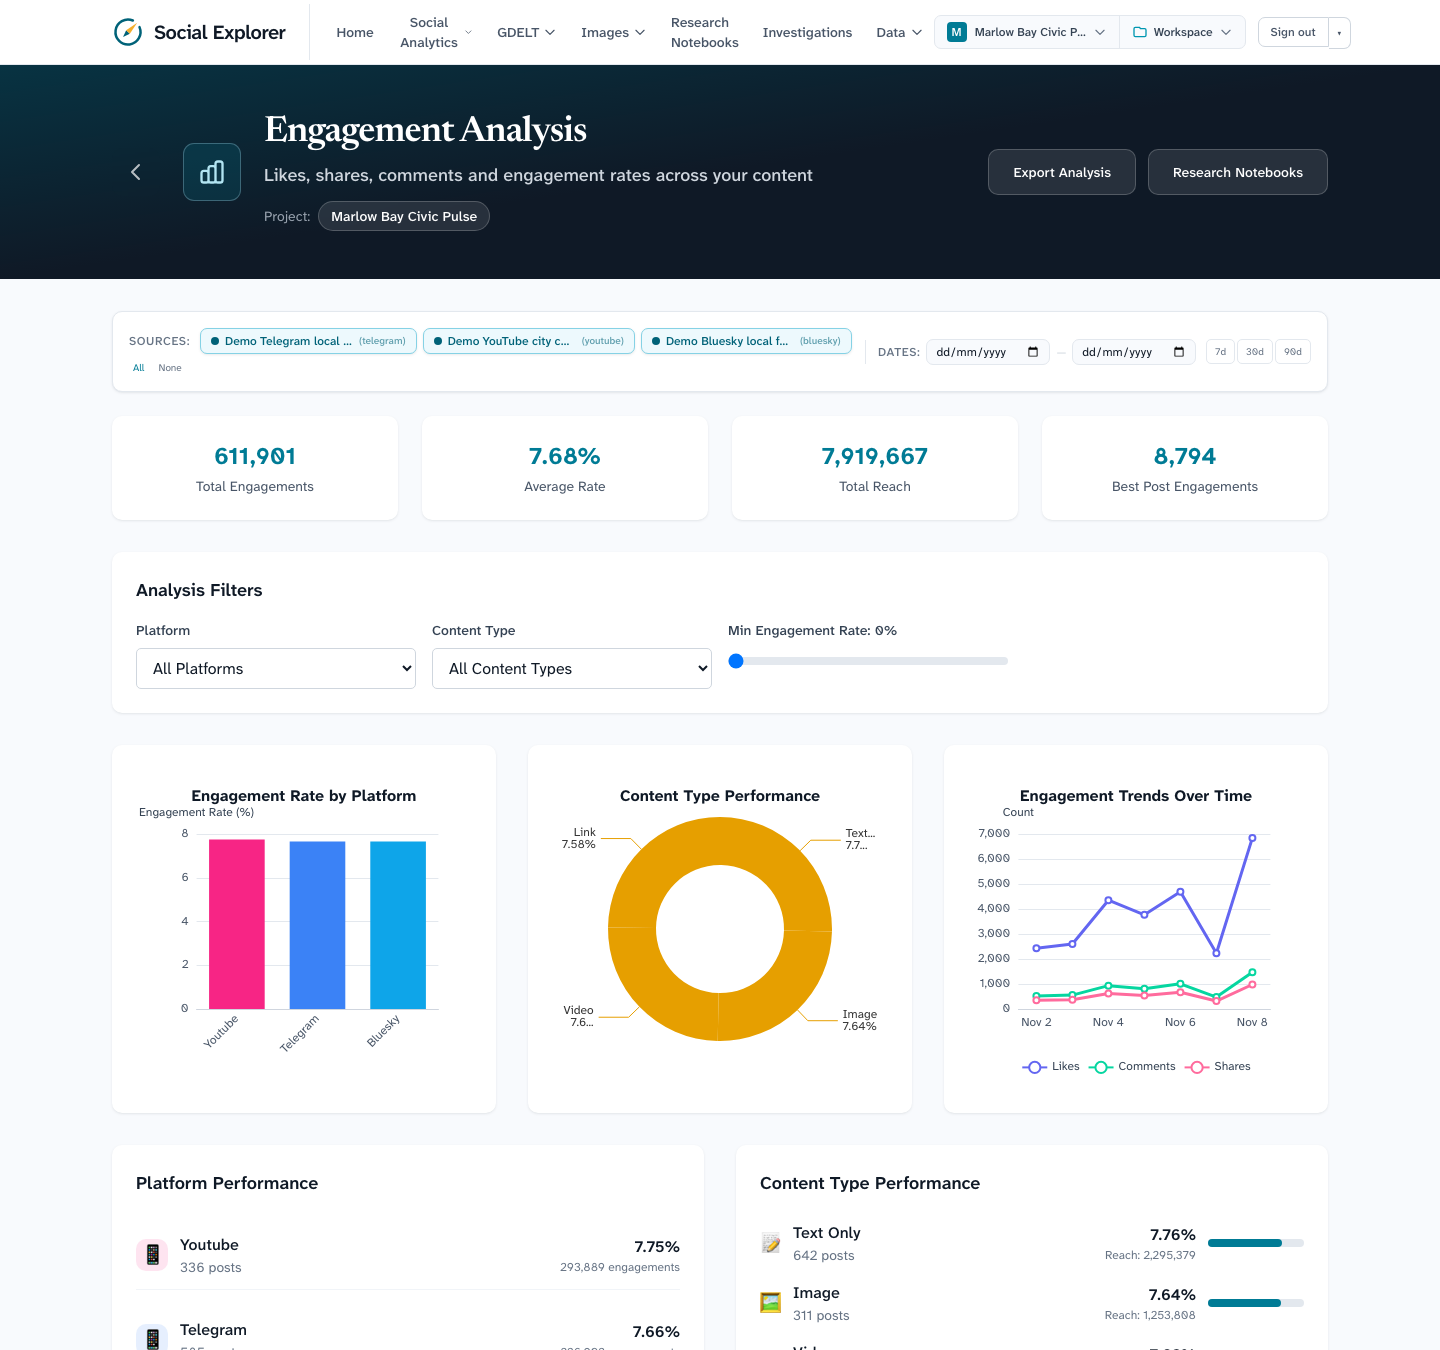
Under Social Analytics → Engagement, totals, average engagement rate and reach are computed from each post's likes, comments, shares and saves, with breakdowns by platform, content type and time of day.
Language detection
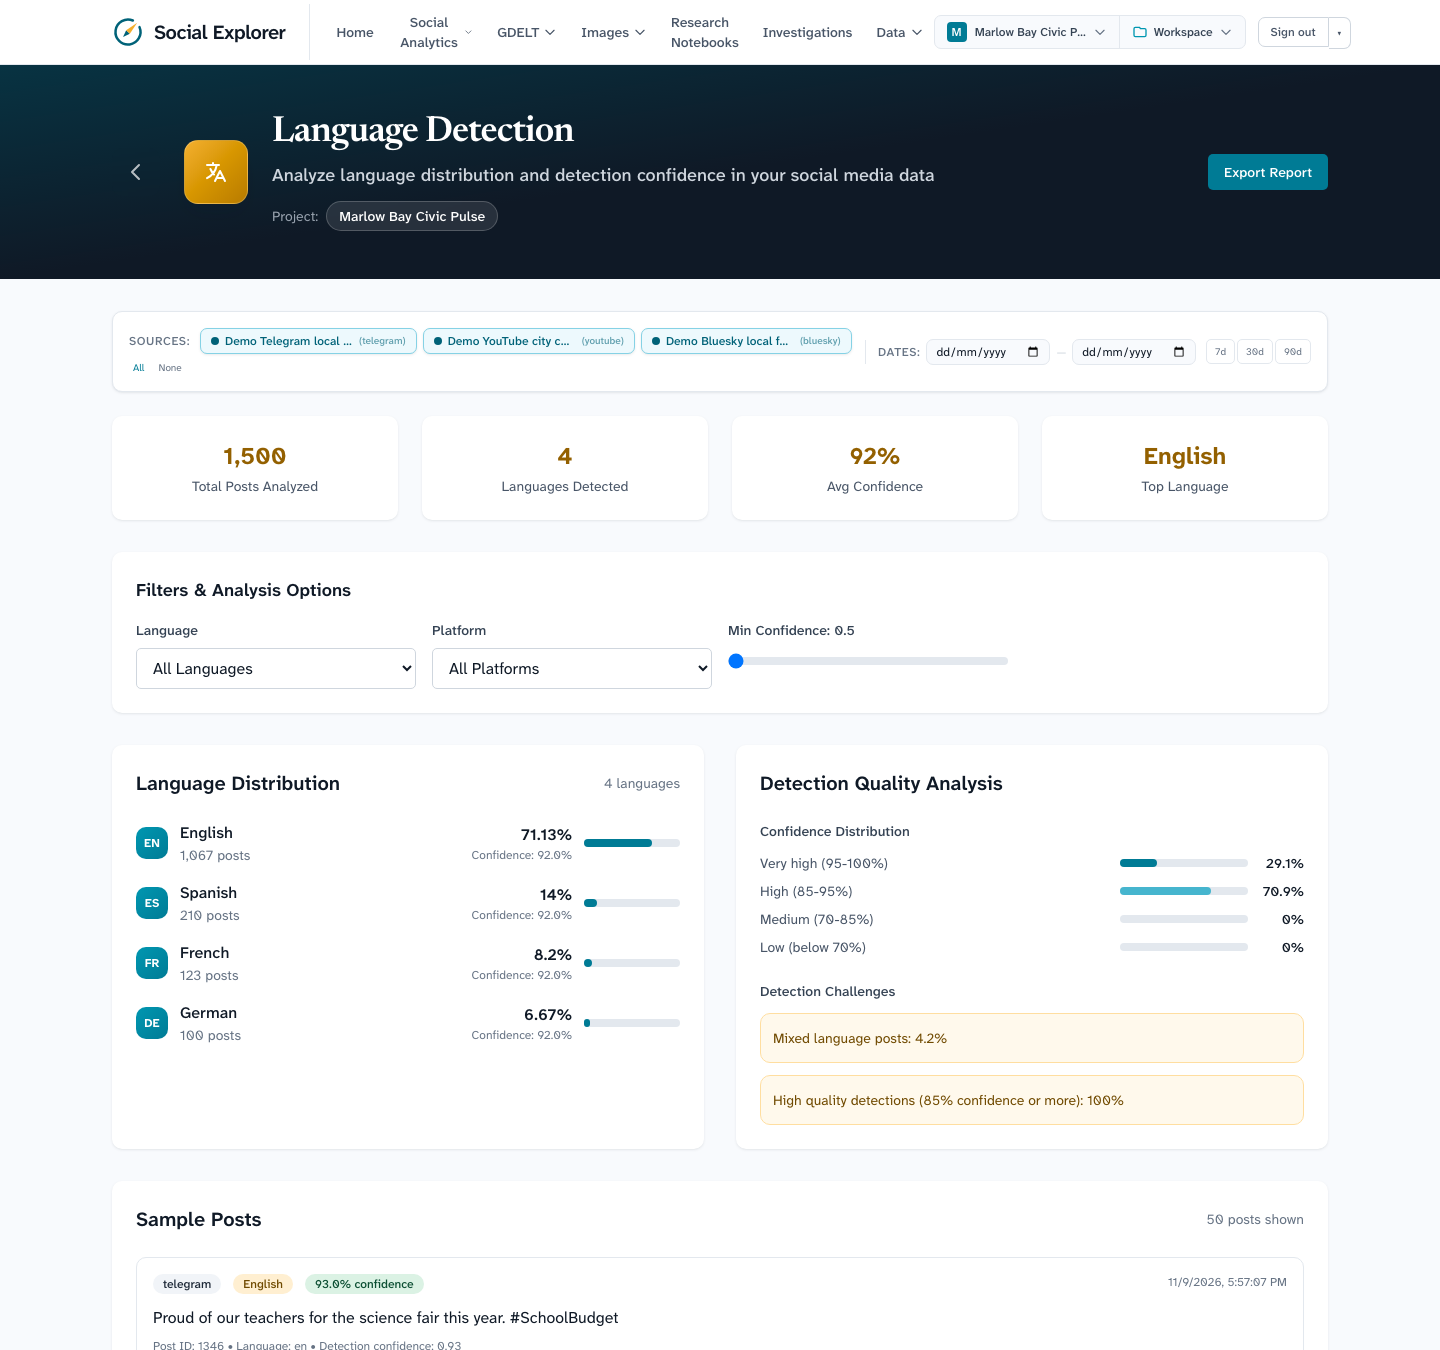
Under Social Analytics → Language Detection, see the languages found, how confident the detector was, and the share of posts that mix languages.
Hashtag analysis
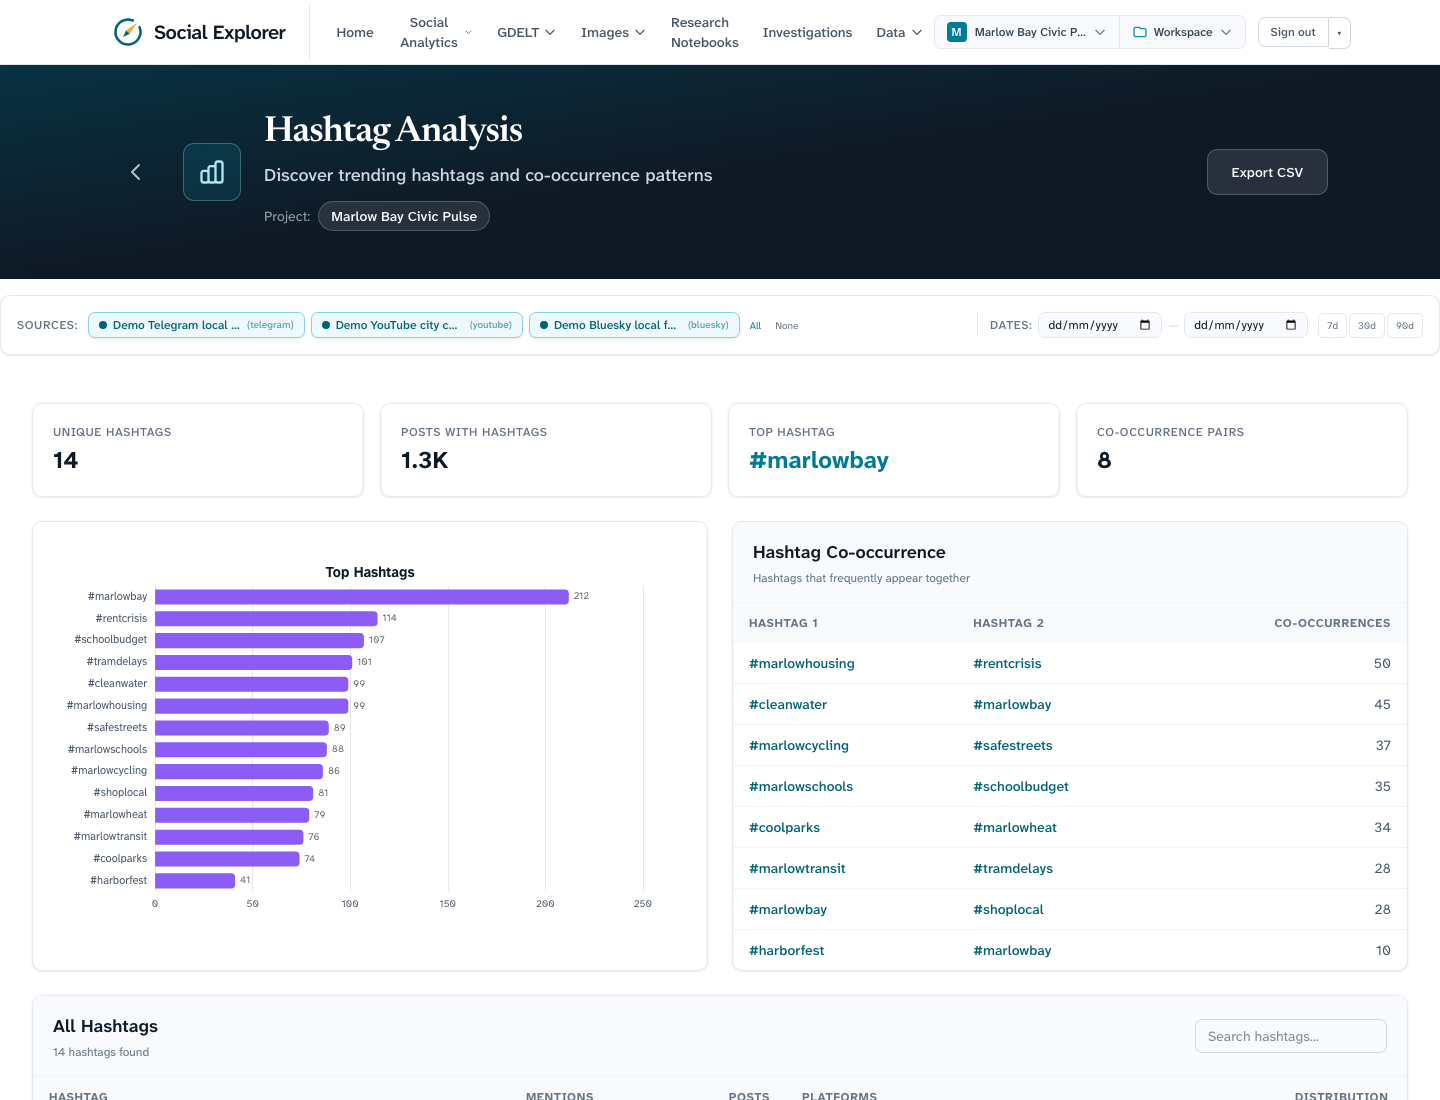
Under Social Analytics → Hashtags, see the most used hashtags and which ones appear together.
Trigram analysis
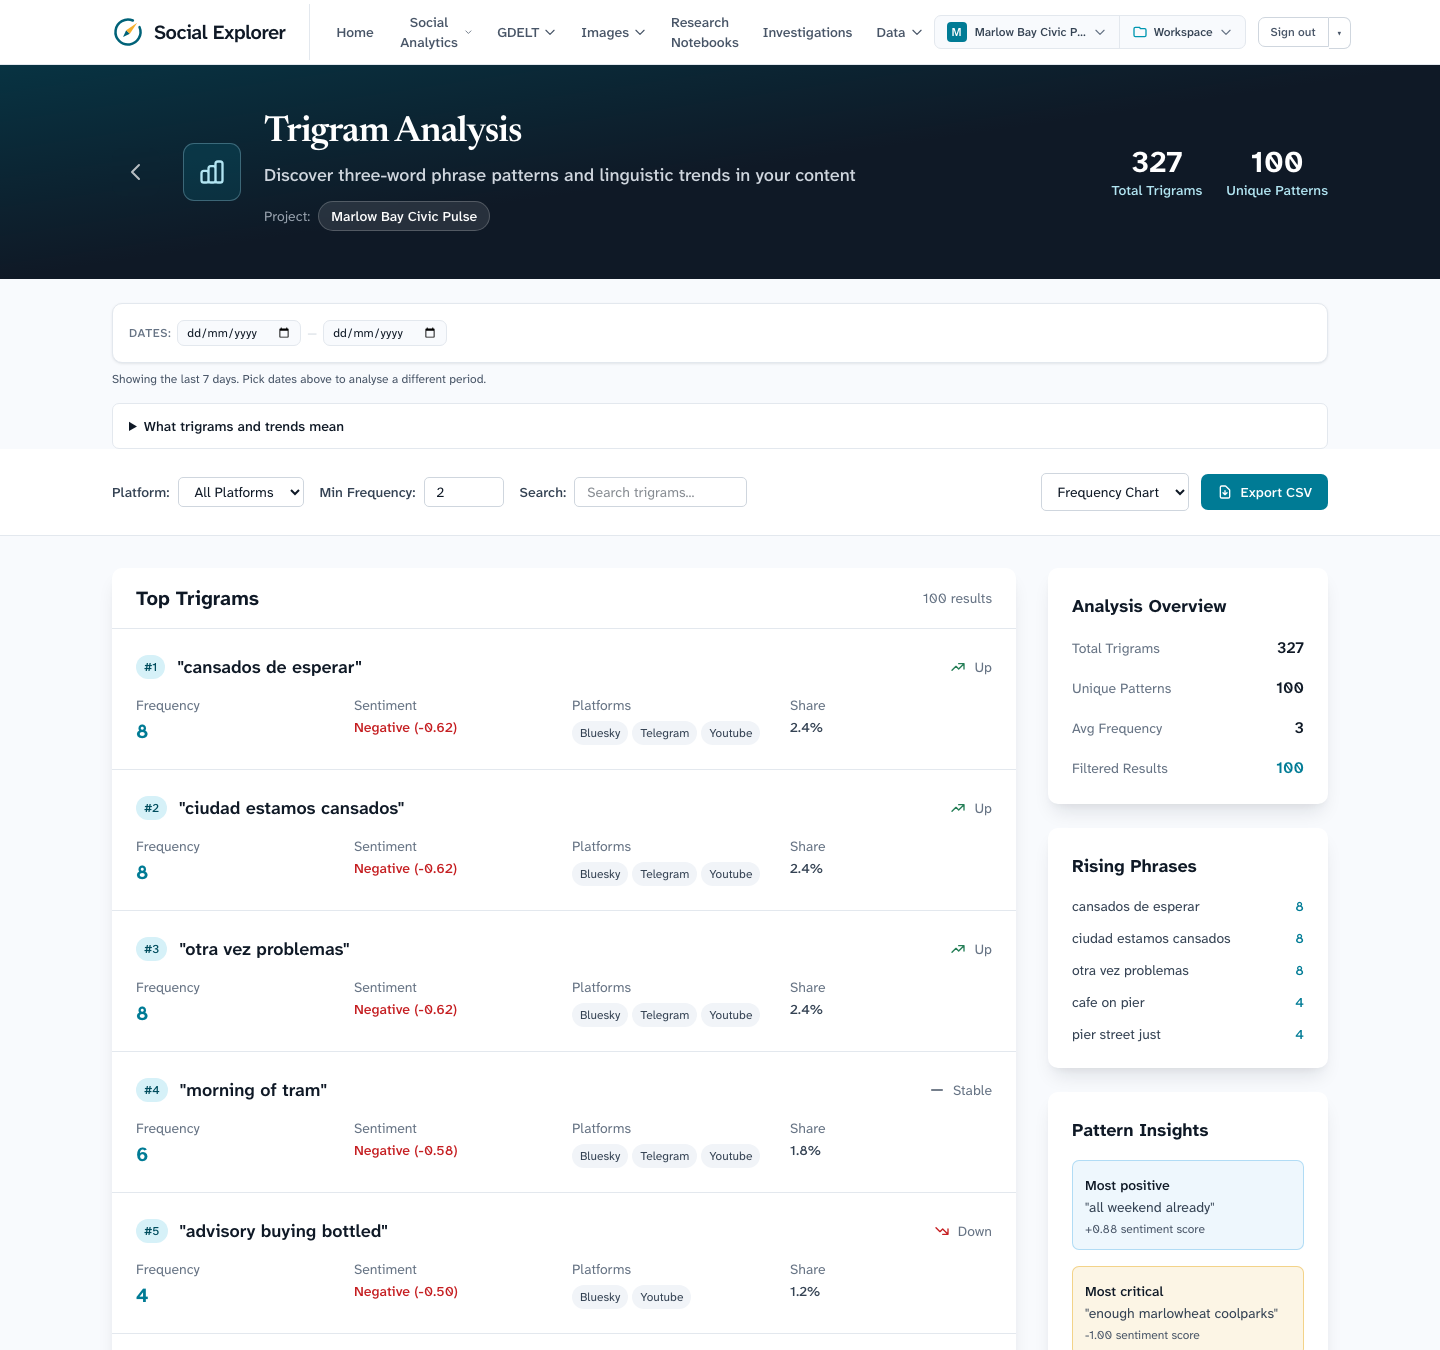
Under Social Analytics → Trigrams, see the three-word phrases that recur in posts, how positive or negative the posts containing them are, and whether each phrase is rising or fading.
What the demo does not cover
The demo fills the core analytics tables. Pages backed by optional pipelines (GDELT events, radio transcripts, image processing, the workflow builder) stay empty until you run those pipelines. The language page has no geographic breakdown, because posts carry no location data.
Regenerating the screenshots
Use a disposable stack
The tutorial spec deletes projects, investigations and workflows named Tutorial project, Tram delays and Sentiment of posts before it starts, on whatever stack the account can reach. It is skipped unless you set ALLOW_DOCS_CLEANUP=1; do that only against the demo stack.
The images above come from the same data. With the stack running and demo data loaded:
cd ex-accell-ui
SCREENSHOT_BASE_URL=http://localhost:3000 \
SCREENSHOT_EMAIL=<admin email> SCREENSHOT_PASSWORD=<admin password> \
ALLOW_DOCS_CLEANUP=1 npm run docs:screenshots
They are written to docs-site/public/screenshots/ using a fixed 1440px viewport. The same command also replays the tutorials against the demo data (creating and then deleting a project, an investigation and a workflow) and saves their screenshots under screenshots/tutorials/.