

Explore the analytics dashboards
The Social Analytics menu holds one dashboard per kind of analysis. They share the same controls, so once you know one you know them all.
You need: the stack running and the demo data loaded.
Controls every dashboard shares
- Sources: chips for each data source (here, the three demo sources). Click one to include or exclude it; All and None are shortcuts.
- Dates: two date pickers, plus 7d, 30d and 90d buttons.
- Workspace: when a workspace is selected (see Your first project), every dashboard is limited to that workspace's datasets.
Sentiment analysis
Social Analytics → Sentiment Analysis.
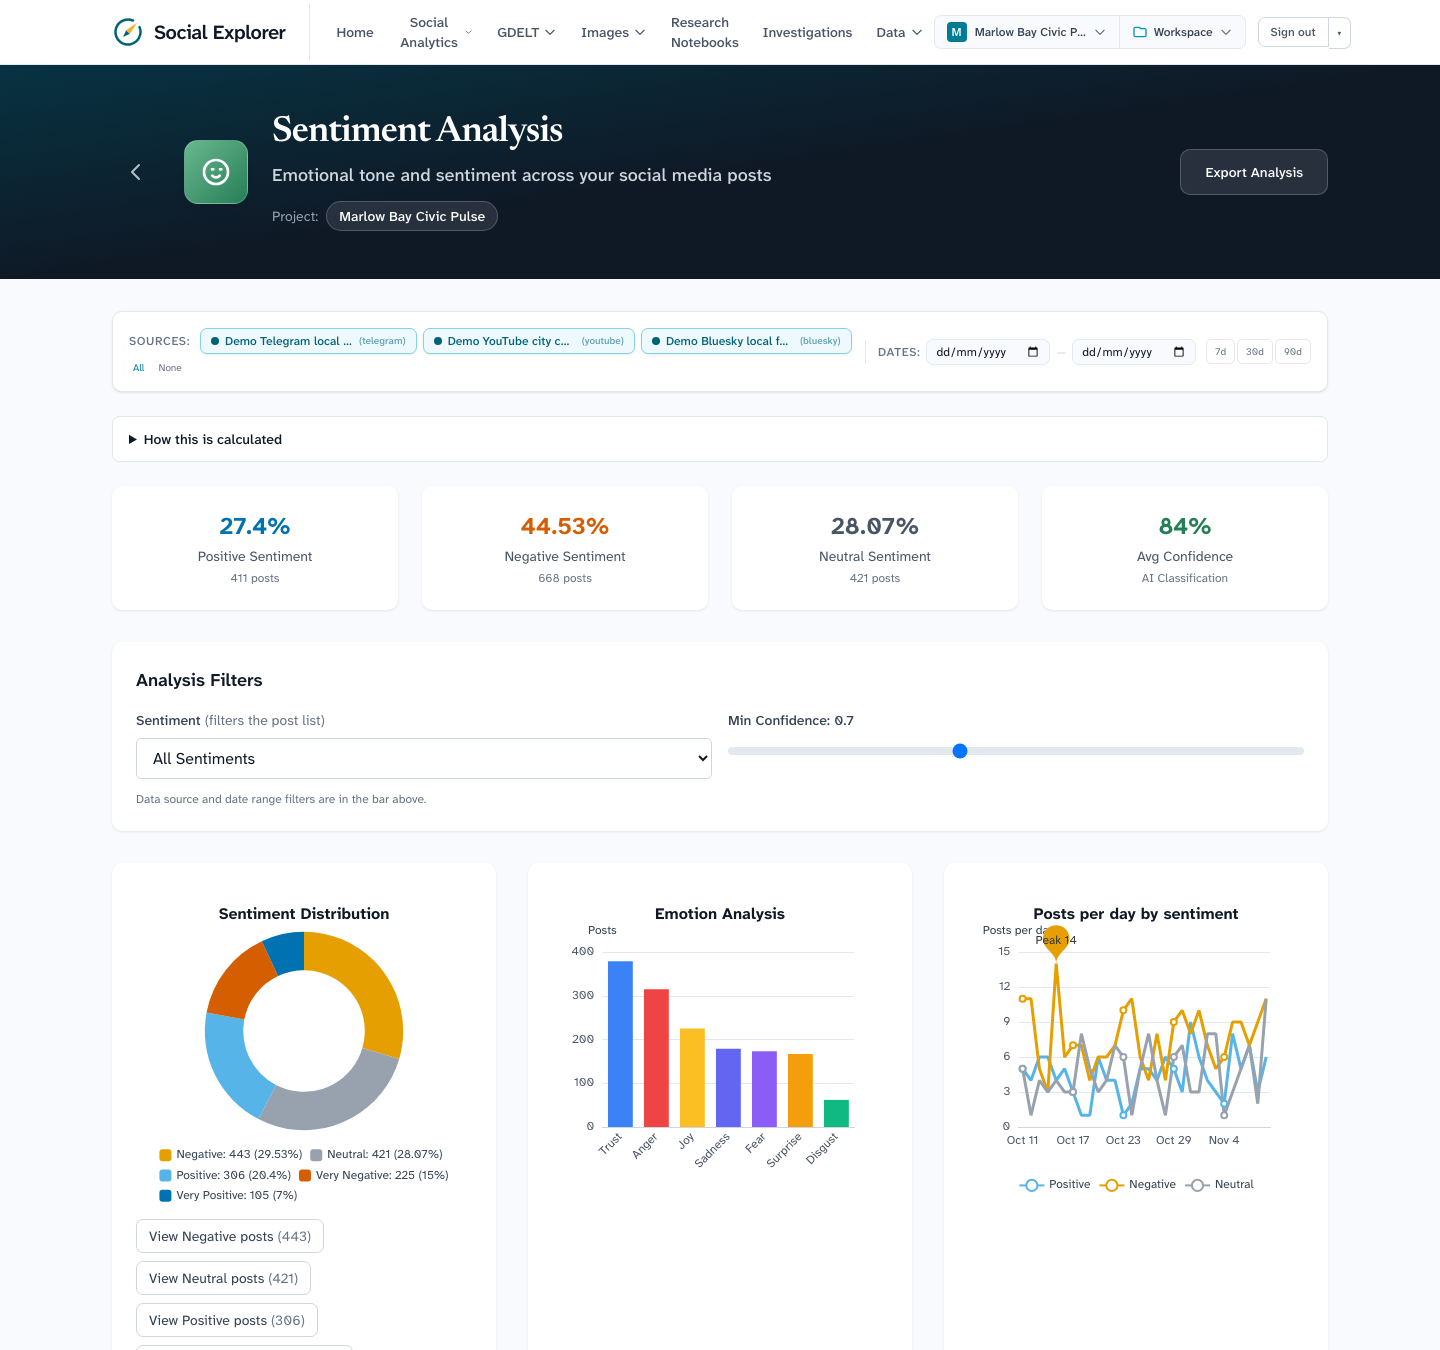
- The four cards give the positive, negative and neutral share of posts and the average classifier confidence.
- Use Sentiment to focus on one category and Min Confidence to hide uncertain classifications.
- The charts show the distribution, the emotions behind it, and the trend over time.
- Scroll to Post Analysis to read individual posts with their classification and confidence.
Try this: the demo data has a burst of negative public transit posts about two thirds of the way through the window. Find it on the trend chart, then filter Sentiment to Negative and read the posts.
Topic modeling
Social Analytics → Topic Modeling.
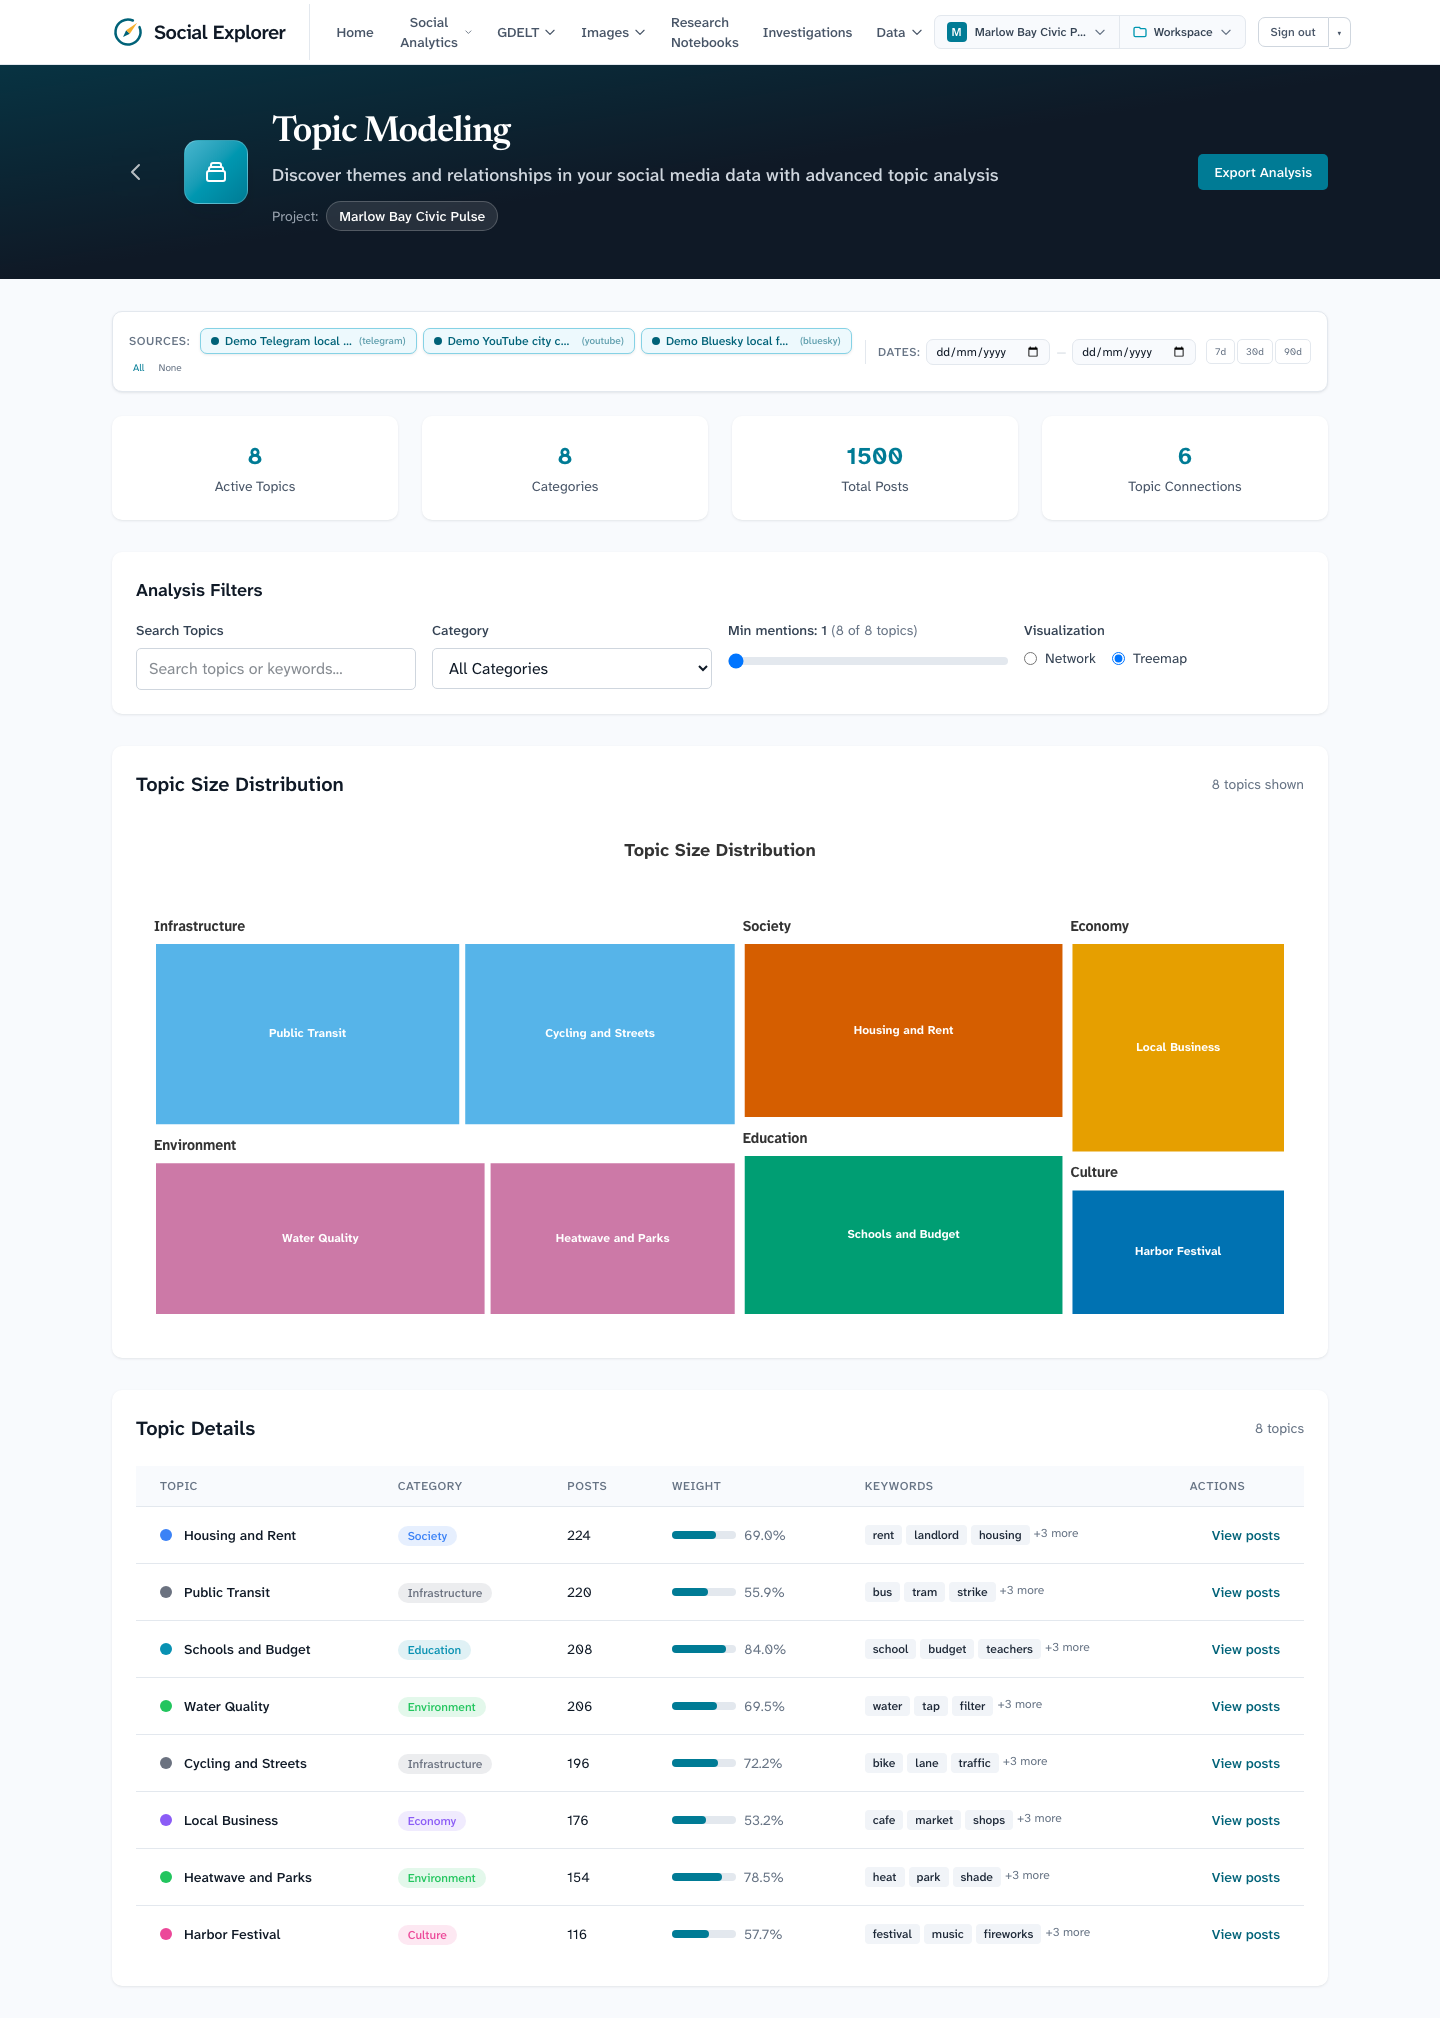
- Topic Relationship Network shows how topics relate; switch to Treemap to compare sizes.
- Use Search Topics, Category and Min mentions to narrow the list.
- Topic Details ranks topics by number of posts and shows their keywords.
Language detection
Social Analytics → Language Detection.
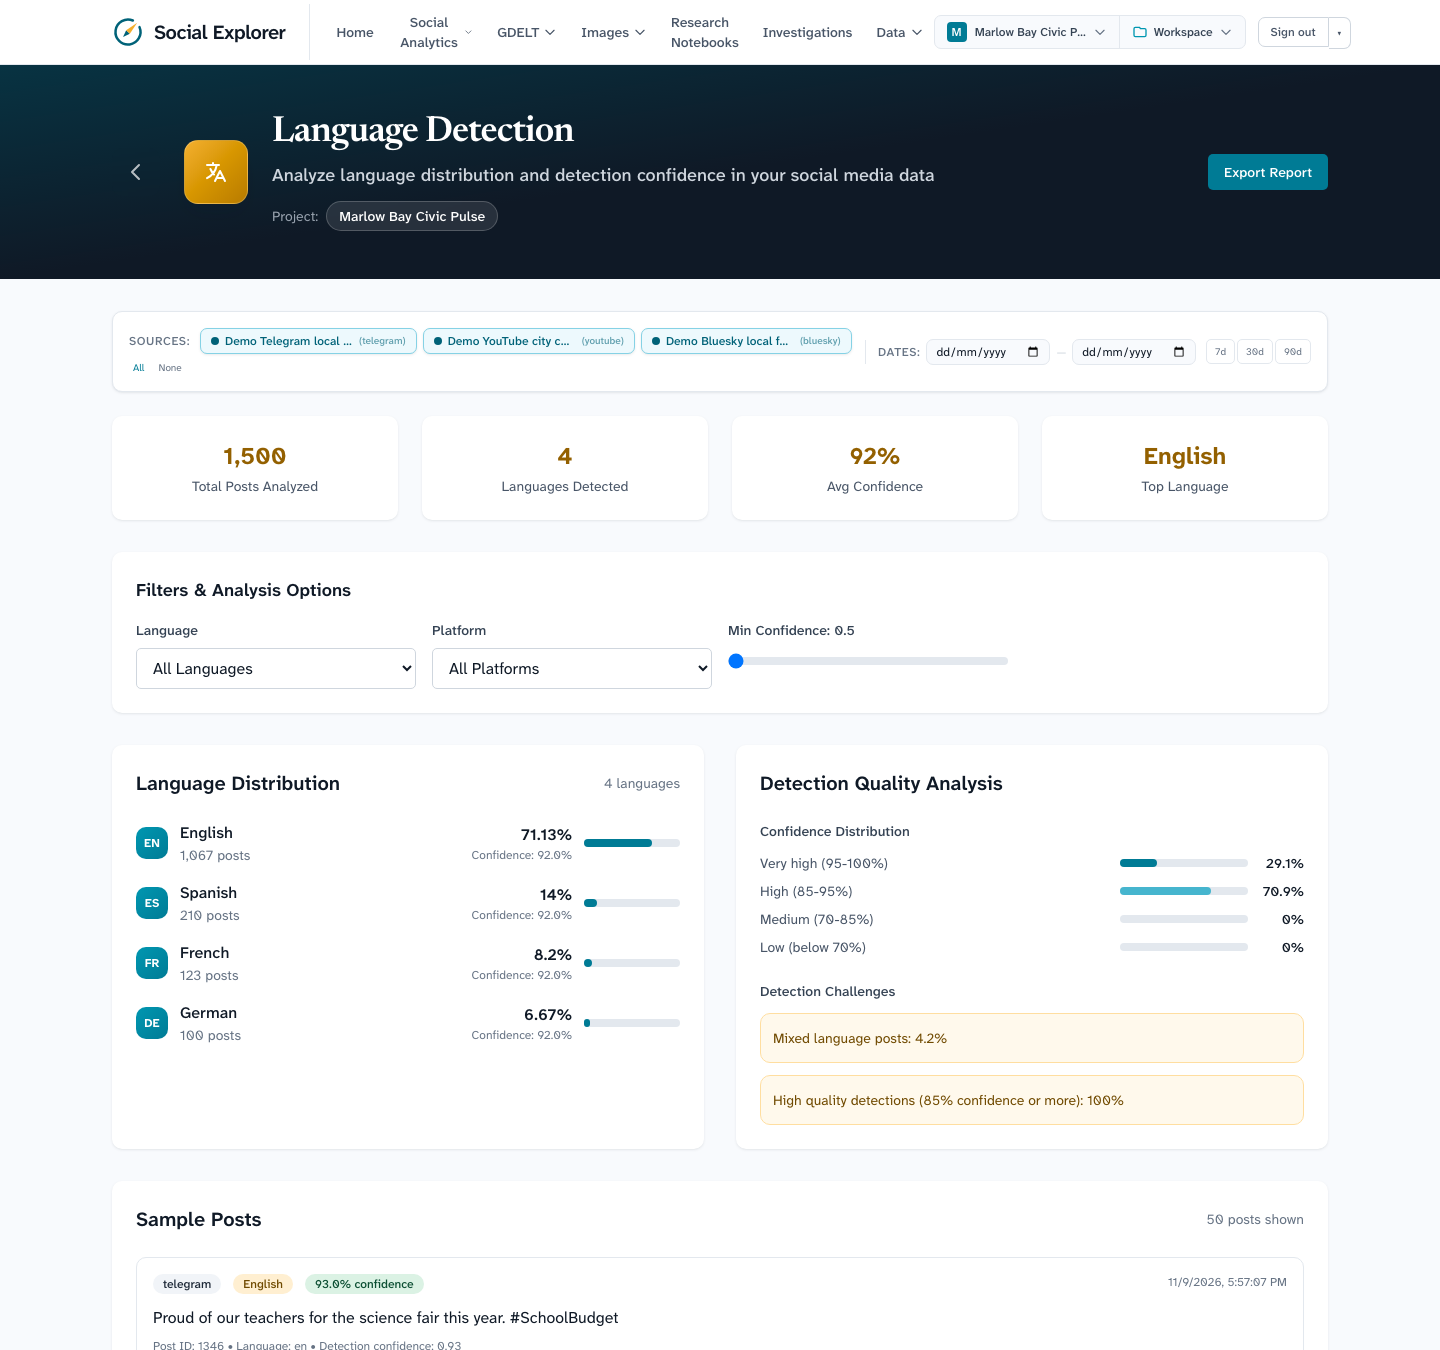
The cards summarise how many languages were found and the average confidence. Language Distribution lists each language with its posts and confidence, Detection Quality Analysis shows how many detections were very high, high, medium or low confidence and how many posts mix languages, and Sample Posts lets you inspect examples. There is no geographic breakdown because posts carry no location.
Engagement analysis
Social Analytics → Engagement.
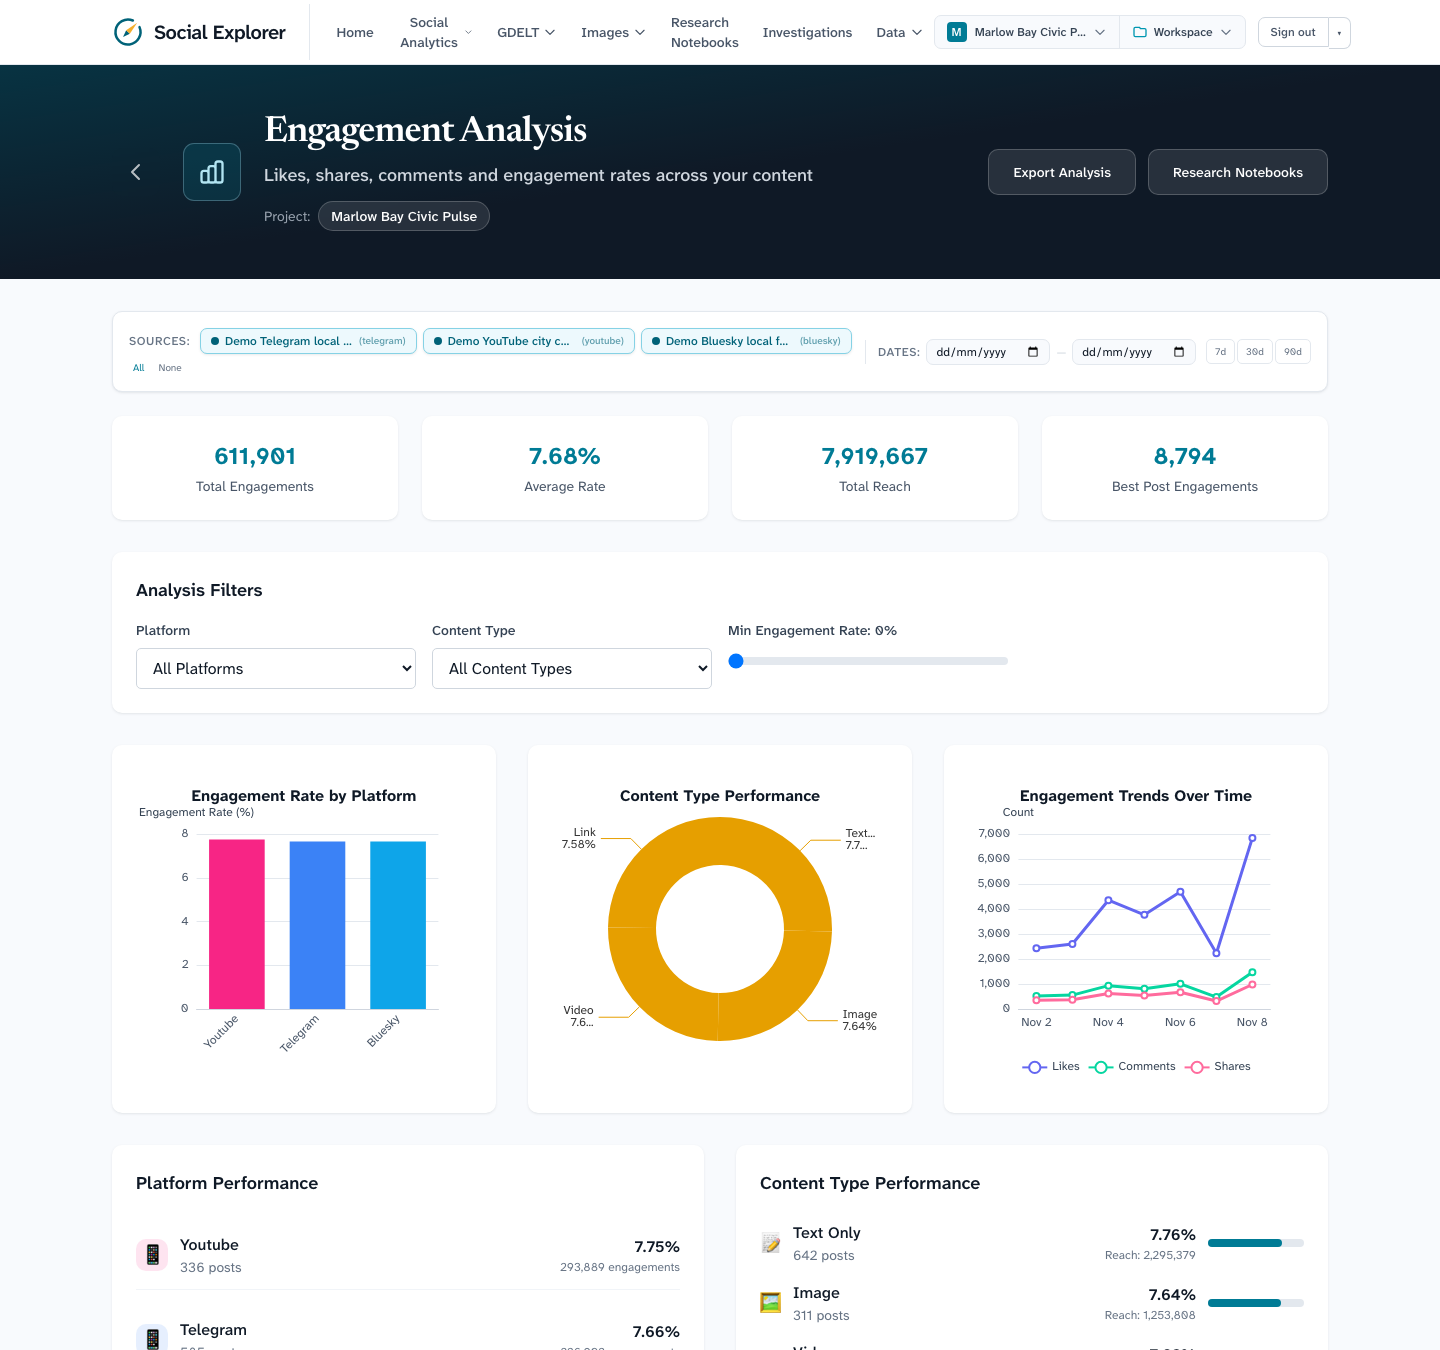
Totals and the average rate come from each post's likes, comments, shares and saves. Compare platforms, content types and trends over time, and see which posts performed best.
Hashtag analysis
Social Analytics → Hashtags.
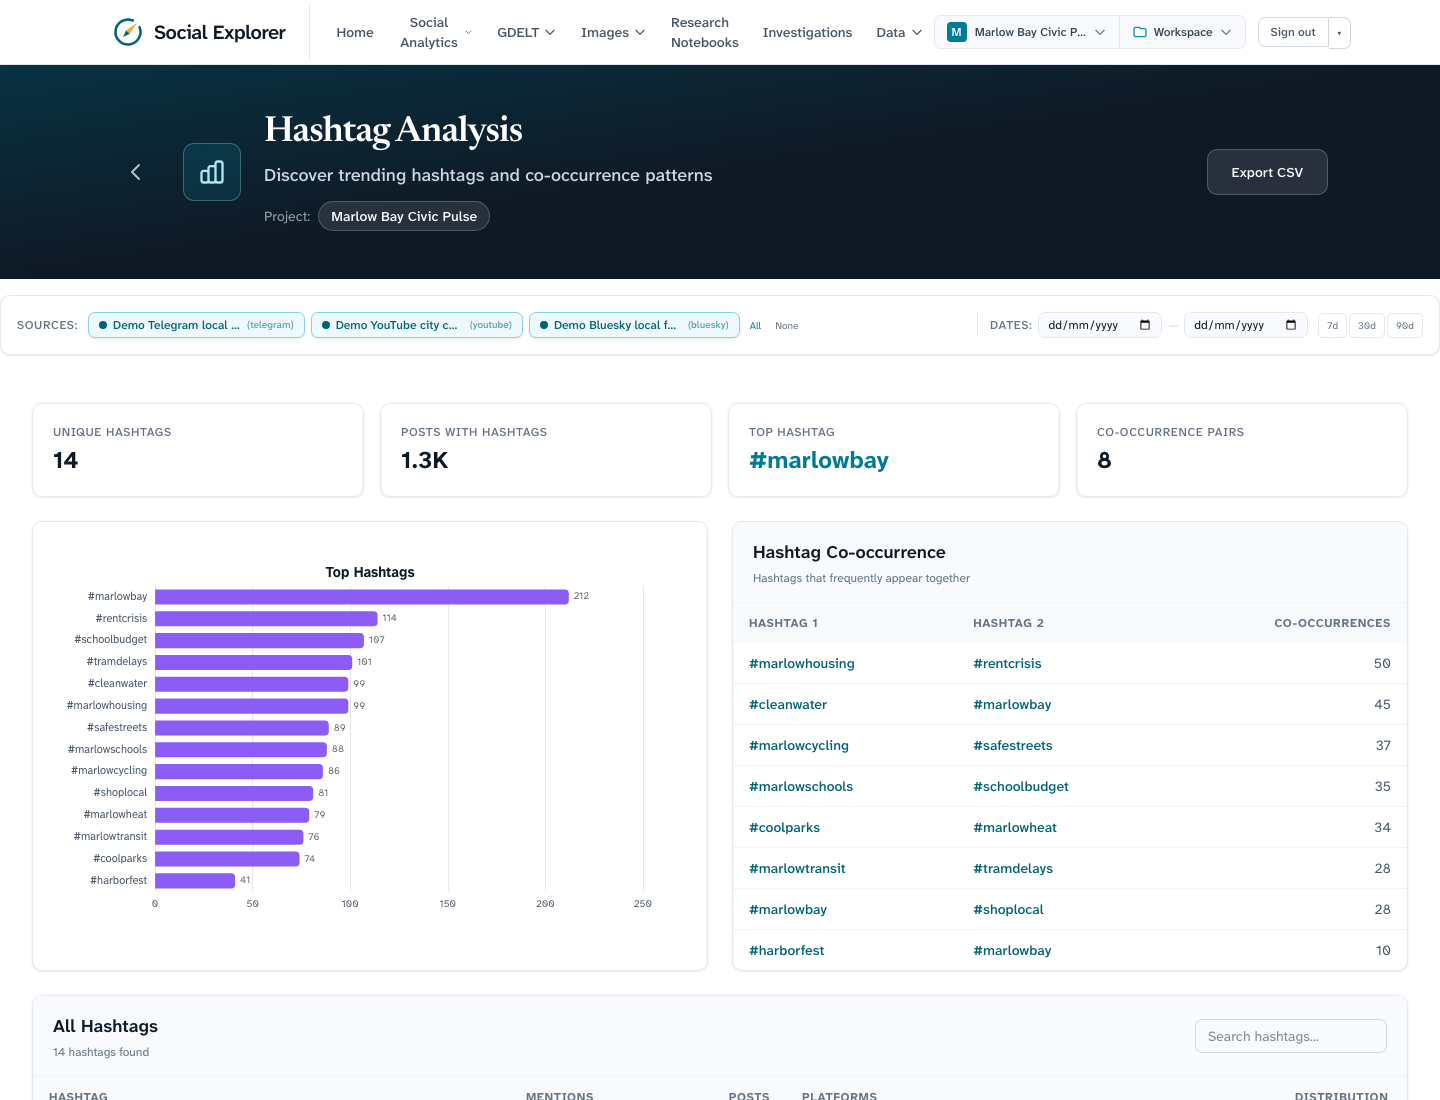
The bar chart ranks hashtags by use; Hashtag Co-occurrence lists pairs that appear together.
Trigram analysis
Social Analytics → Trigrams.
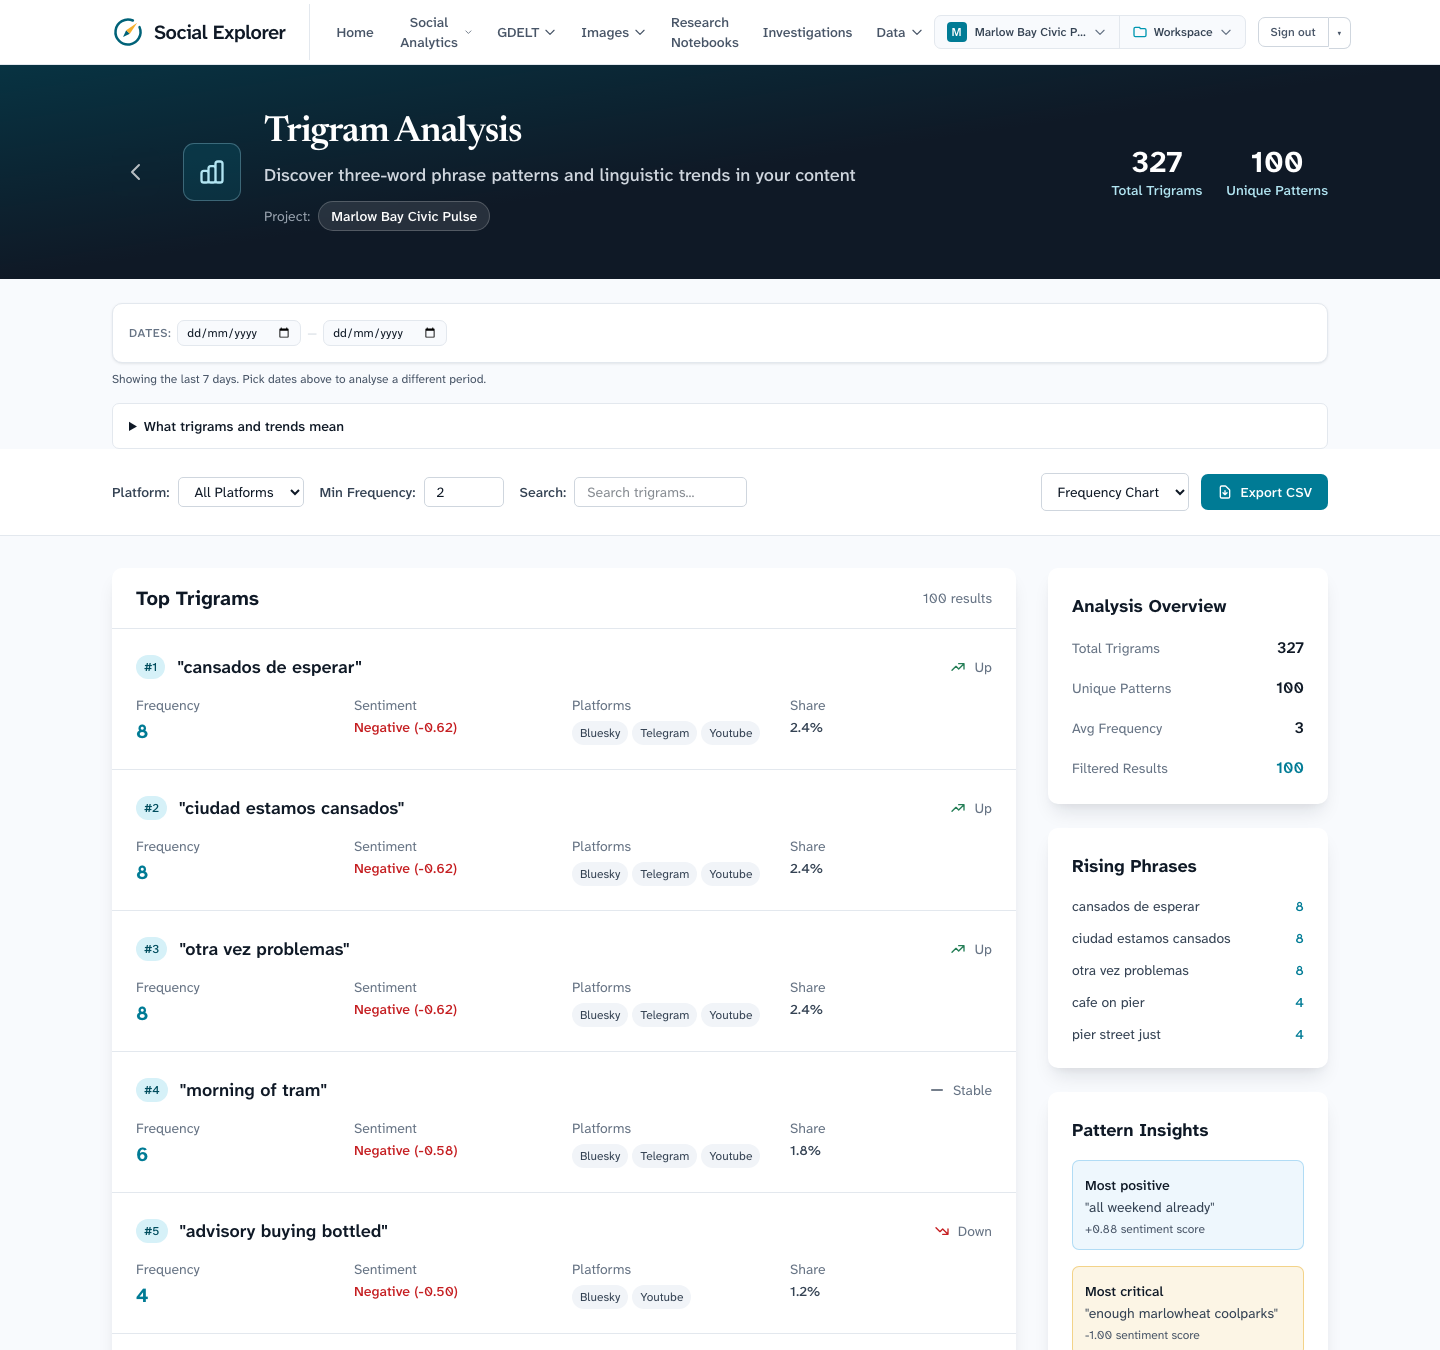
A trigram is a three-word phrase. The list shows how often each appears, how positive or negative the posts containing it are, whether it is rising or fading, and the platforms it appears on. Use Search to find a phrase and Export CSV to download the table. The side panels list the rising phrases and the most positive and most critical ones.
If a dashboard looks empty or shows a red banner
An empty state means there is no data for that module yet. A red banner at the top of the page means a request failed (for example the database is unreachable). See Troubleshooting.
Next
Investigate a question across these posts.